Graph theory & computational geometry
Redistricting with graph theory
Geospatial Analytics & Software Engineering
Constructing connected districts from Census tract graphs, then evaluating geographic compactness and population balance.
Project description
From the original project page. Results and time references describe that version of the work.
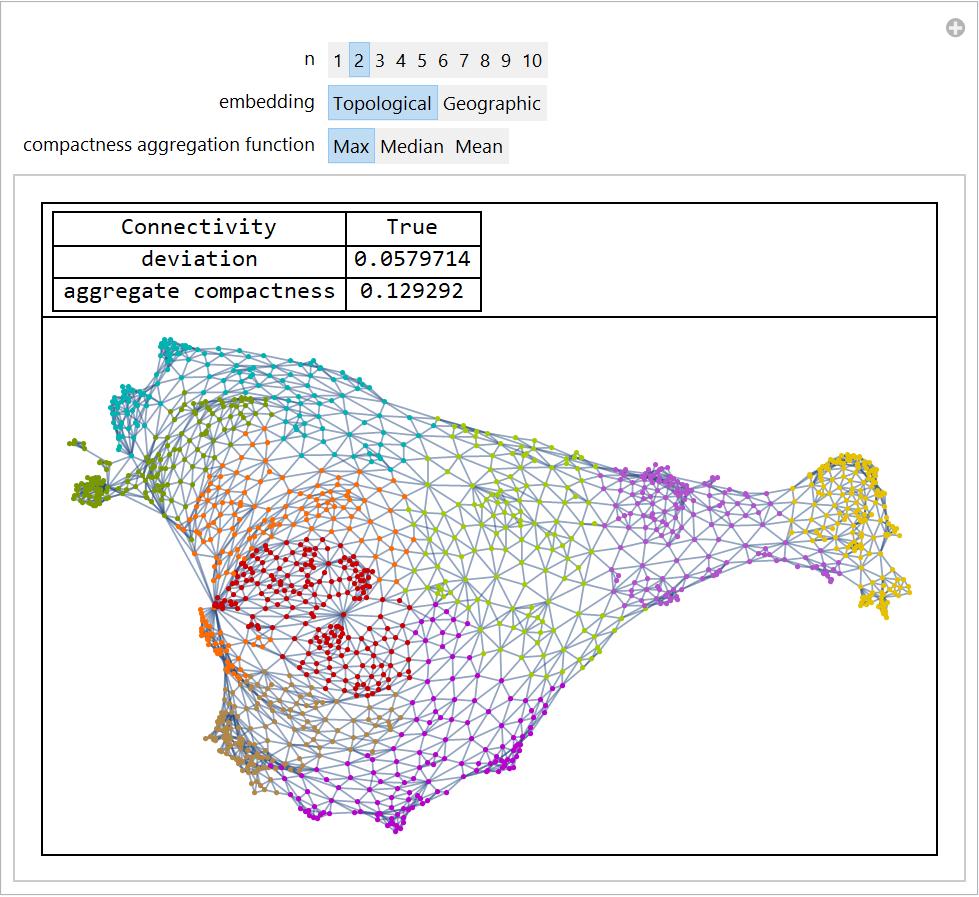
I started my research in gerrymandering when I was 15, looking for indicators of racial and political gerrymandering. My first published work in the field was the following post that I wrote in high school that has since received 8,000 views. My project merged graph theory and computational geometry to analyze and create political districts in the Wolfram Language. I converted Census data into networks and partitioned the networks into the number of districts in each state. I then reconverted each sub-network into compact and contiguous geometric districts and ran statistical tests identifying racial and political gerrymandering.
https://community.wolfram.com/groups/-/m/t/1381570
Over the Spring semester of Junior year, I created a cross-platform, responsive, web application to highlight Gerrymandering with a team. I led the backend development of our website, API development, and data collection.
From Census tracts to district maps
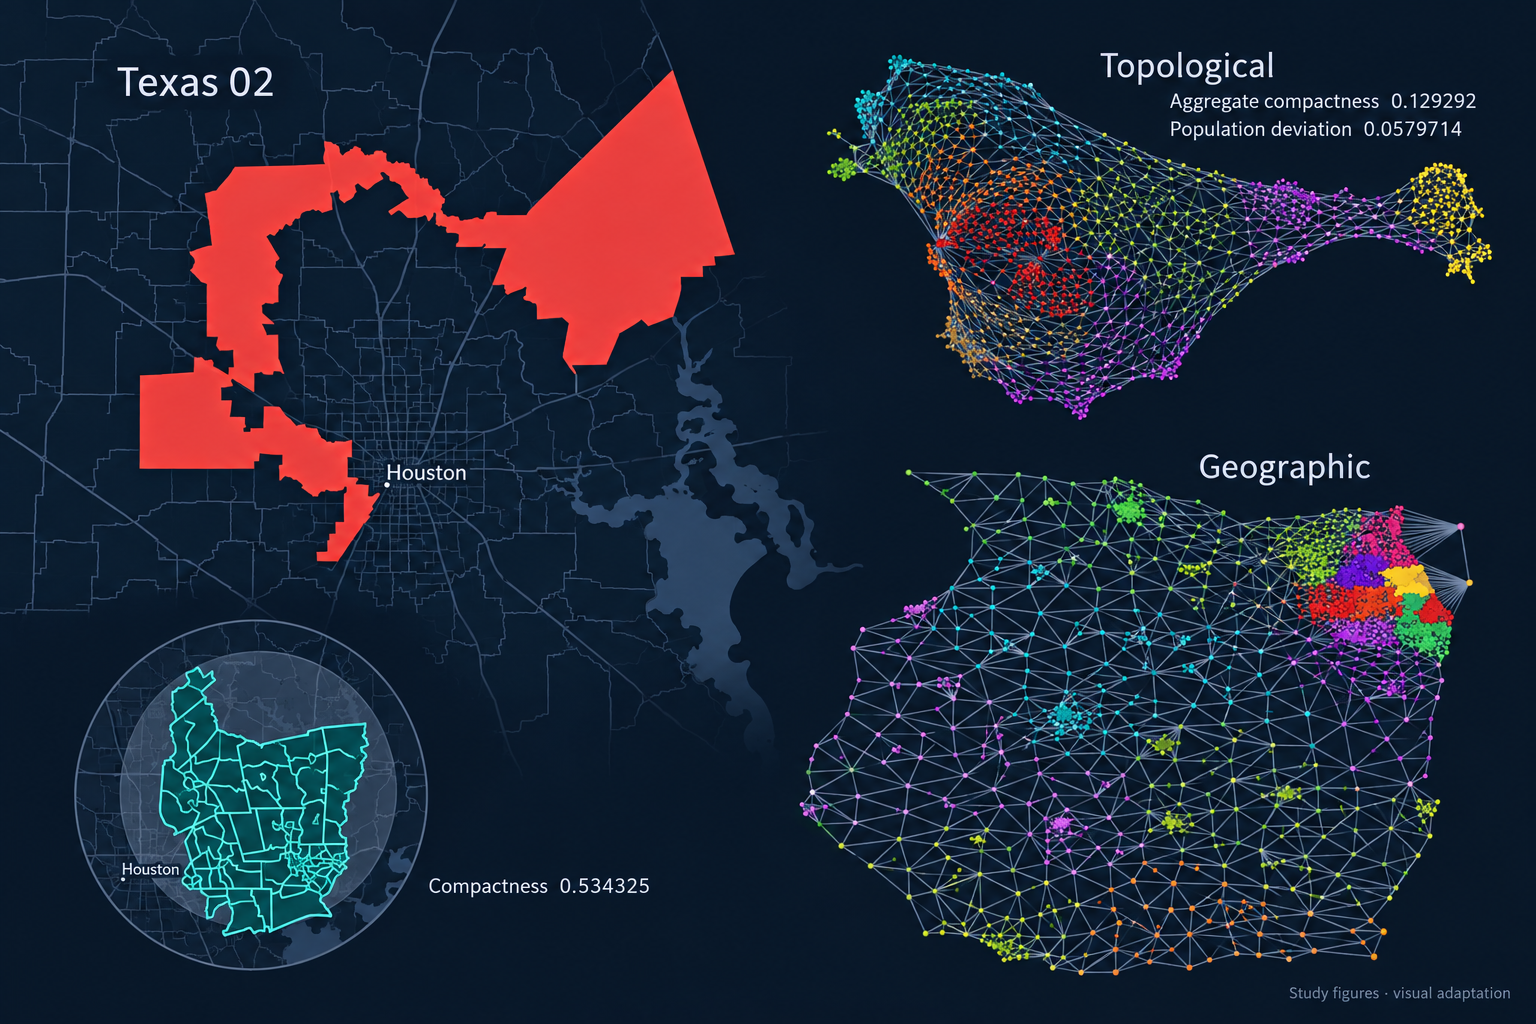
Represented Census tracts as graph vertices and shared borders as edges. Population weights and county-aware edge weights guided graph partitioning; connectivity checks selected contiguous district candidates. Census polygons then turned each graph partition back into a geographic district.
Measuring the geometry
Compared synthetic and real congressional districts using geographic compactness: district area divided by the area of its smallest enclosing circle. The Wolfram Language research, completed in 2017 and published in 2018, also explored population balance and demographic distributions. Compactness is one property of a district, not a complete measure of electoral fairness.
GerryMap
GerryMap is the collaborative web application described above. I led backend development, API development and data collection. The source code is available on GitLab in the research materials below.